Product Statment
Managers face difficulties in monitoring live chat conversations and identifying any issues or trends that impact customer satisfaction. They lack a centralized location where they can access real-time insights and data to make informed decisions and take corrective action.
Solution
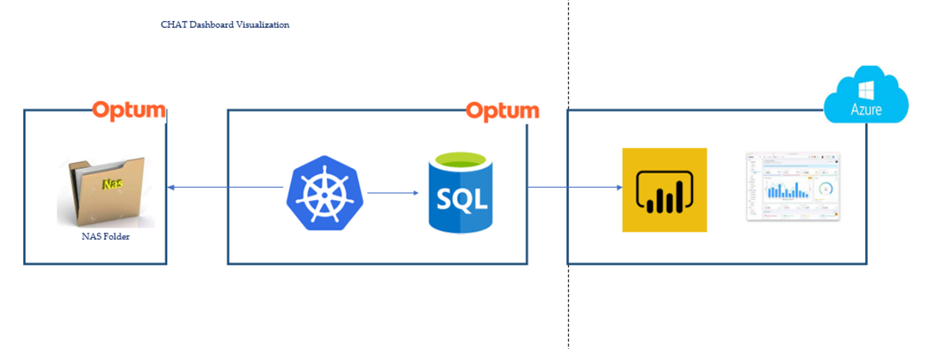
A Live Chat Dashboard enables managers to monitor and manage live chat conversations by displaying key metrics such as active chats, response time, queue status, and resolved chats. It also provides insights into individual agent performance and allows sentiment analysis of customer interactions. The visualization is carried out in Power-BI and the formulating logic for each graph is developed using Python. The source of data is changed to my-SQL, resulting in a dashboard with expedited performance.
Product Values
- Centralized location: The Live Chat Dashboard provides a centralized location for managers to access real-time insights and data to make informed decisions.
- Real-time insights: The Live Chat Dashboard provides managers with real-time insights into live chat conversations, allowing them to quickly identify any issues and take corrective action as necessary.
- Individual agent performance: The Live Chat Dashboard provides valuable insights into the performance of individual agents, allowing managers to identify top-performing agents and those who may need additional training or support.
- Sentiment analysis: The Live Chat Dashboard allows managers to monitor the sentiment of customer interactions by analyzing the language used in chat transcripts, helping to identify any trends or issues that may be impacting customer satisfaction.
- Improved customer experience: By providing real-time insights and data, the Live Chat Dashboard helps managers make informed decisions to improve their team's performance, optimize their customer service operations, and enhance the overall customer experience.
Key Metrics
- Number of active chats: This metric shows the current number of chats that are being handled by the team, allowing managers to understand the workload and identify any potential bottlenecks.
- Average response time: This metric shows the average time it takes for an agent to respond to a chat, allowing managers to identify any issues with response times and take corrective action as necessary.
- Number of chats waiting in the queue: This metric shows the number of chats that are waiting to be handled by the team, allowing managers to understand the demand and allocate resources accordingly.
- Number of chats resolved: This metric shows the number of chats that have been successfully resolved, allowing managers to understand the team's productivity and identify areas for improvement.
- Agent performance metrics: These metrics include the number of chats each agent has handled, their average response time, and their customer satisfaction ratings, allowing managers to identify top-performing agents and those who may need additional training or support.
- Sentiment analysis: This metric allows managers to monitor the sentiment of customer interactions by analyzing the language used in chat transcripts, helping to identify any trends or issues that may be impacting customer satisfaction.
Target Customers
Tech Stack
Architecture Diagram
Team
| Saputo Marta | McGaughey, Todd | Kiran Chowdhary | Ayushi Sharma | Madhulika Varanasi | Prakhar Goyal |
| Dir Product | Product Manager | Sr Principal Engineer | Assoc Software Engineer | Assoc Software Engineer | Assoc Software Engineer |
| marta.saputo@optum.com | todd.mcgaughey@optum.com | kiran_chowdhary@optum.com | ayushi_sharma587@optum.com | madhulika_varanasi@optum.com | prakhar_goyal@optum.com |
References
Release Notes
GitHub